Excel Tables PivotTables and Charts Quick Reference Guide
$6.95
Available via Printed/Laminated (Shipped/Physical) or PDF (Download Only):
| Quantity: | Price: |
|---|---|
| 1-49 | $6.95 |
| 50-99 | $5.70 |
| 100-499 | $4.75 |
| 500-999 | $4.10 |
| 1000+ | $3.95 |
Description
| Subject: | Excel |
|---|---|
| Subject Matter: | Tables, PivotTables and Charts |
| Level: | Intermediate/Advanced |
| Topics Covered: | 59 |
| Pages: | 4 |
| Dimensions: | 11 x 17″ – Folded |
| Availability: | Printed & Laminated or PDF Download |
| ISBN: | 978-1-958446-21-8 |
Product Description
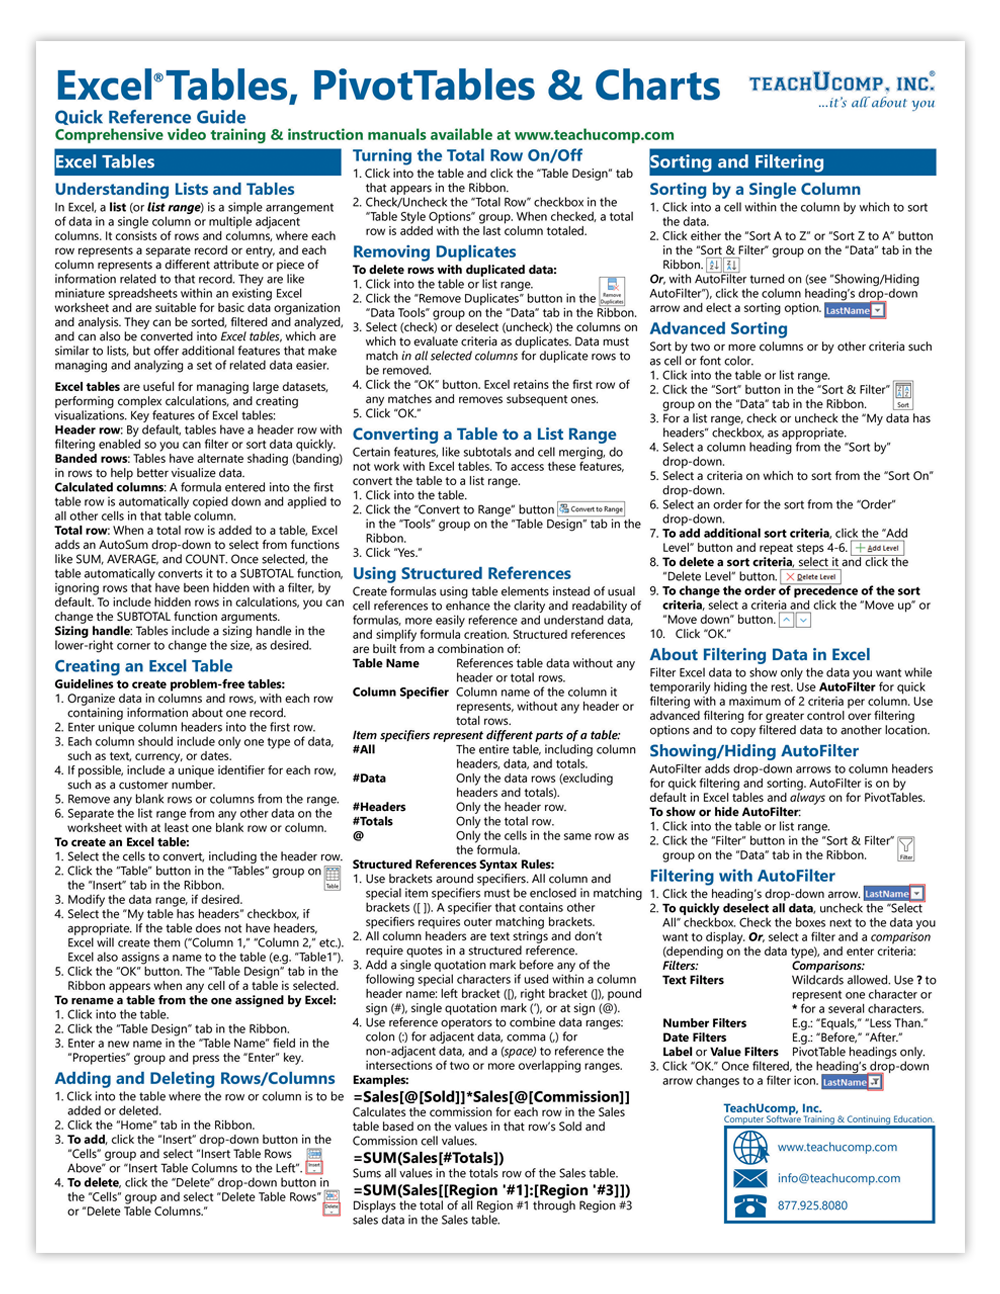
Designed with the busy professional in mind, this 4-page quick reference guide provides step-by-step instructions for Excel Tables, PivotTables, and Charts. When you need an answer fast, you will find it right at your fingertips with our Microsoft Excel Tables, PivotTables, and Charts Quick Reference Guide. Clear and easy-to-use, quick reference cards are perfect for individuals, businesses and as supplemental training materials.
Topics Covered:
Excel Tables
Understanding Lists and Tables
Creating an Excel Table
Adding and Deleting Rows/Columns
Turing the Total Row On/Off
Removing Duplicates
Converting a Table to a List Range
Using Structured References
Sorting and Filtering
Sorting by a Single Column
Advanced Sorting
About Filtering Data in Excel
Showing/Hiding AutoFilter
Filtering with AutoFilter
About Advanced Filtering
Advanced Filter Syntax
Creating Advanced Filters
Clearing Filtering
Grouping and Subtotaling List Data
PivotTables
About PivotTables
Creating a PivotTable or PivotChart from Worksheet Data
Rearranging a PivotTable
Changing Calculated Value Fields
Show/Hide the PivotTable Fields Pane
Refreshing a PivotTable
Adding a PivotChart to a PivotTable
Sorting and Filtering a PivotTable
Filtering with Timelines and Slicers
Analyzing Multiple Data Sources
Adding Excel Workbook Tables to a Data Model
Relating Tables in a Data Model
Managing a Data Model
Creating a New PivotTable from a Data Model
Charts
Inserting a Chart
Selecting Charts and Chart Objects
About Chart Editing and Formatting
Resizing a Chart in a Worksheet
Changing the Chart Type
Moving a Chart
Adding a Data Series
Hiding or Removing a Data Series
Adding an Axis Title
Moving a Title
Adding a Chart Title
Switching Rows and Columns
Adjusting the Numeric Scale
Creating a Chart with Two Scales
Adjusting the Legend
Adding Gridlines
Adding Explanatory Text
Adding Shapes
Adding Data Labels
Moving, Formatting, and Editing Data Labels
Adding Trendlines to a Data Series
Removing Trendlines
Exploding Pieces of a Pie Chart
Handling Hidden and Empty Cells
Using Styles and Layouts
Creating a Custom Chart Template
Applying a Custom Chart Type
Setting the Default Chart Type